8 May
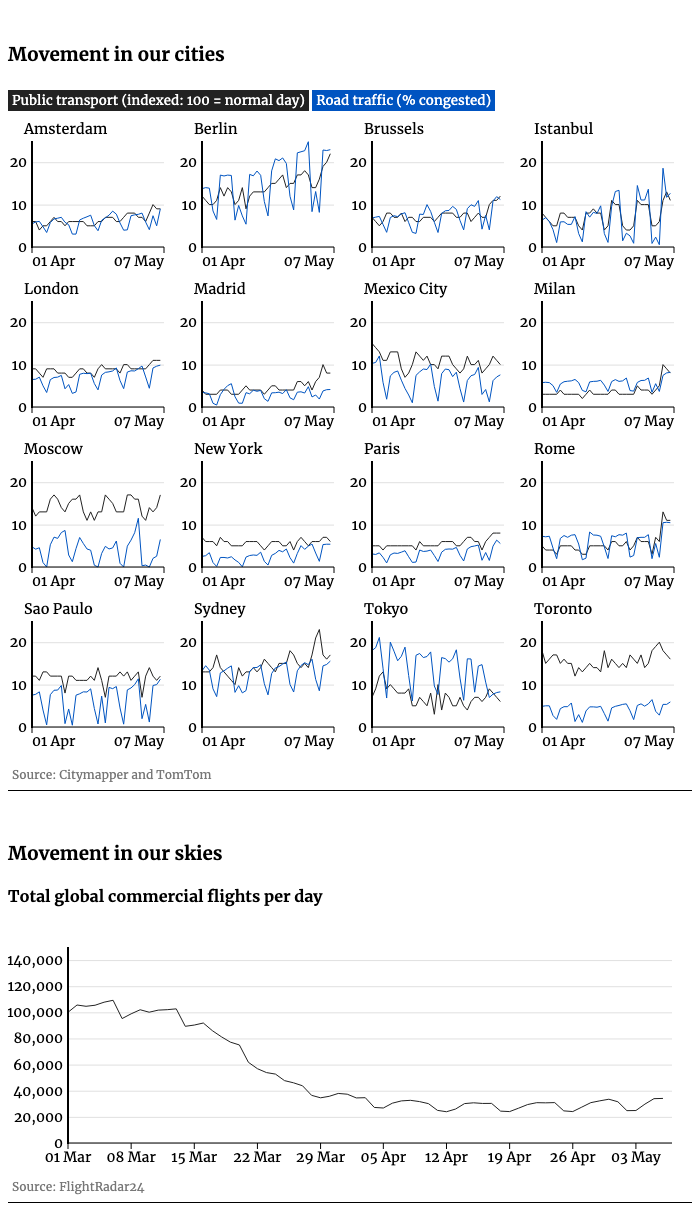
Road traffic and public transport use in Berlin, Rome, Milan and Madrid have picked up as governments in Continental Europe eased lockdown restrictions this week.
All four cities showed a definite uptick in mobility – although movement in Milan and Rome remains at roughly 10 per cent of the levels seen before Covid-19 struck.
Go deeper with GlobalData

Discover B2B Marketing That Performs
Combine business intelligence and editorial excellence to reach engaged professionals across 36 leading media platforms.
That may well reflect some confusion and compromises in new rules introduced in Italy, which mean most shops will remain closed for another fortnight and people are only permitted to visit family and those with whom they have a “stable and enduring” link.
Road congestion and public transport use in Berlin rose above 20% of pre-lockdown levels this week; Madrid saw public transport use double.
Among countries where strict lockdowns remain in place, London saw public transport use creep above 10% of pre-lockdown levels – a result, perhaps, of somewhat confusing messages about how and when the Westminster government plans to ease current restrictions, as well as anecdotally-reported “lockdown fatigue” as bright spring weather tests people’s resolve.
The Covid-19 lockdown: tracking if, when and where the world starts moving again
This graphic is fed by three key sources.
We use Citymapper’s mobility index to monitor public transport use, TomTom’s live traffic index to measure road use, and summary data from FlightRadar24 to count the total number of commercial flights each day.